Bruwi62
-
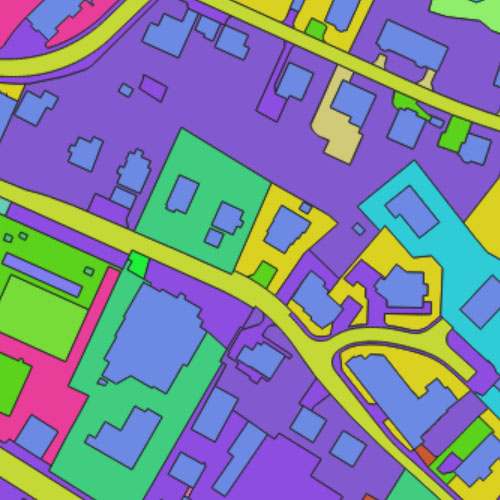
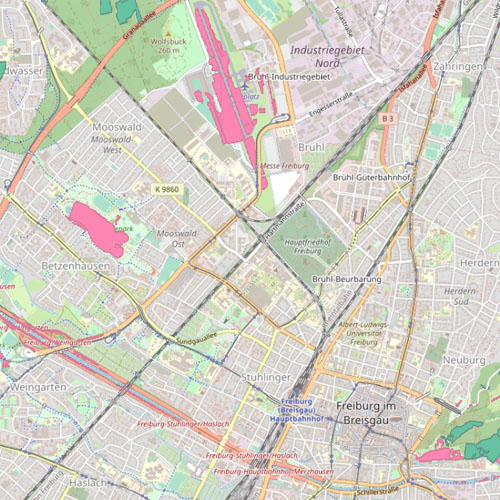
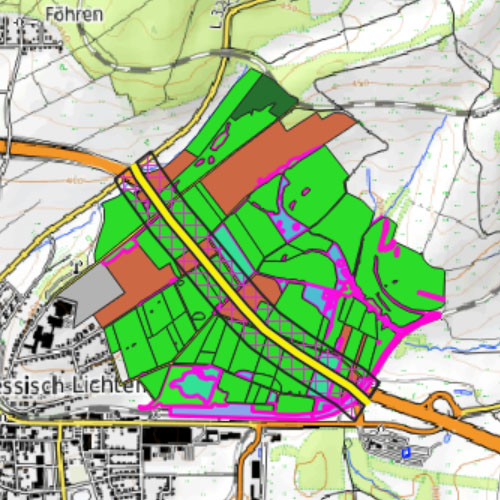
Biotoptypenkartierung Stadt Zürich
-
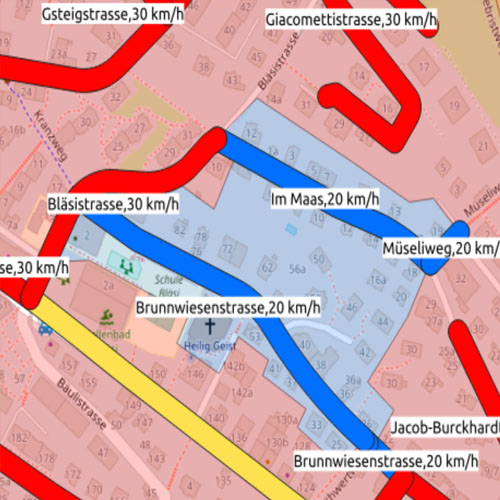
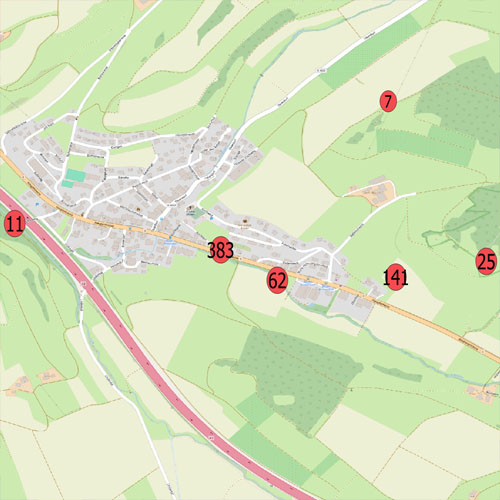
Signalisierte Geschwindigkeiten in der Stadt Zürich
-
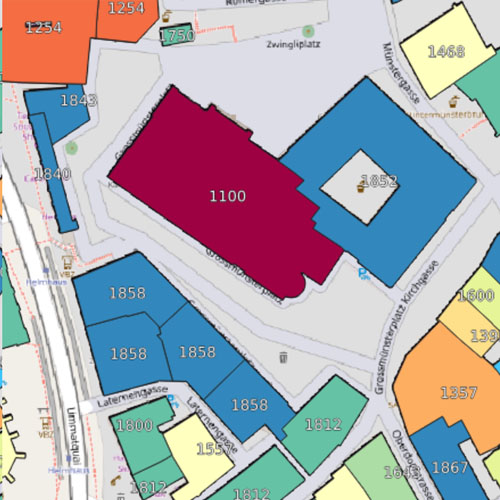
Boezen Flyer
-
Boezen Flyer Vektorkarte
-
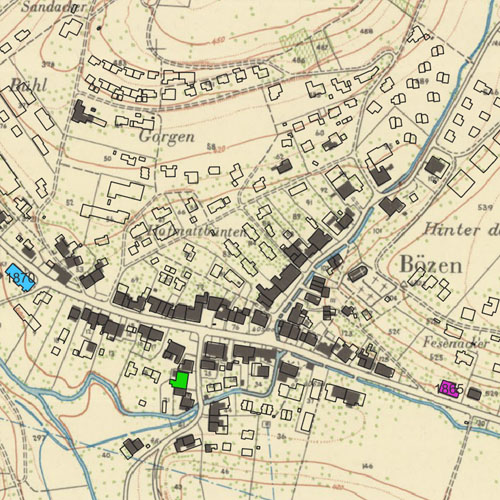
Boezen im Wandel der Zeit
-
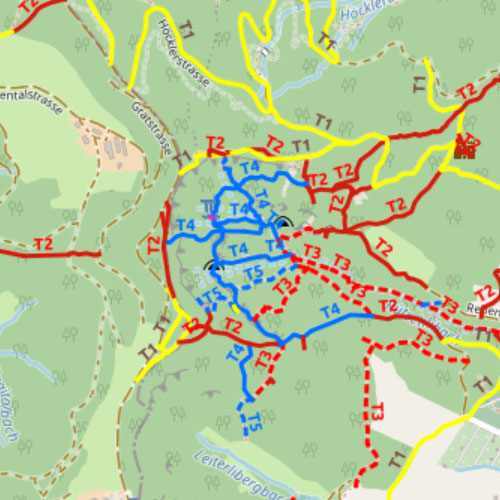
OpenStreetMap KEY:sac_scale Karte
-
OpenStreetMap KEY:sac_scale Karte


Cats

Development


Qgis
Base Layer

- Title
- Demo of TimeManager
- Description
- Demo of Animating Time Series Data (QGIS3)
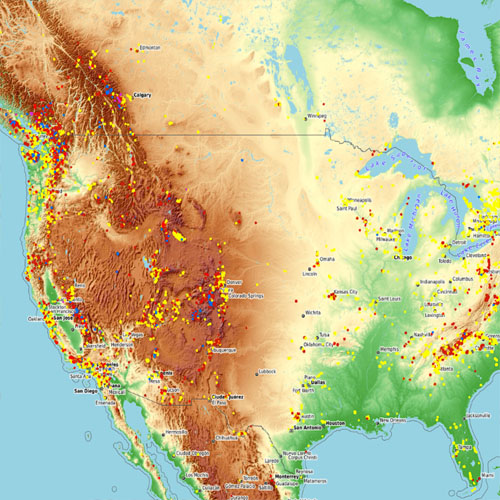
Time is an important component of many spatial datasets. Along with location information, time providers another dimension for analysis and visualization of data. If you are working with dataset that contains timestamps or have observations recorded at multiple time-steps, you can easily visualize it using the Temporal controler. Temporal controler allows you to view and export ‘slices’ of data between certain time intervals that can be combined into animations.
This excellent example from qgistutorials.com shows the working of TimeManager in QGIS. The data ot the events are updated up to April 2022. - Organization
- BERGI IT Consulting
- Person
- Peter Berger
- peter.berger (at) bergi-it-consulting.ch
- Website
- http://www.qgistutorials.com/uk/docs/3/animating_time_series.html
- Projection
- EPSG:3857
- Extent
- -12046950.95329192094504833, -9441985.95004132017493248, 15391923.57664655707776546, 8844884.20826246216893196
- Web Map Service
- WMS Url
- WMTS Url